


Greece's performance in the European Innovation Scoreboard 2021 (EIS), published by the European Commission on 21 June, has significantly improved. On average in the EU, innovation performance has improved by 12.5% since 2014. At 25.9%, Greece is among the 5 countries with an improvement of more than 25% in the period 2014-2021, remaining in the group of Member States with mediocre performance in innovation.
This year’s European Innovation Scoreboard is based on a revised framework, with new indicators for digitalisation and environmental sustainability, aligning the scoreboard with EU policy priorities. In addition to the indicators used to rank countries, the Scoreboard lists a set of indicators that capture the structural features of the innovation environment in each country comparative to the EU. The National Documentation Centre (EKT) contributes to the production of indicators for Greece by providing official statistics on innovation in Greek enterprises, as well as official statistics on R&D expenditure.
According to new data, innovation performance is steadily improving across the EU. As the European Commission points out, 'There is continued convergence within the EU, with lower-performing countries growing faster than higher-performing countries, bridging the innovation gap between them, a trend that also applies to innovation in all EU regions.' Globally, the EU outperforms its competitors such as China, Brazil, South Africa, Russia and India, while South Korea, Canada, Australia, the United States and Japan have a performance lead over the EU.
Sweden continues to be the EU innovation leader, followed by Finland, Denmark and Belgium, with innovation performance well above the EU average (Figure 1). Greece ranks 20th among the 27 EU countries, remaining in the group of member states with a mediocre performance in innovation, below the European average. In the same category with Greece are 8 other countries including Italy, Spain, Portugal and Cyprus.
Performance groups tend to be geographically concentrated, with pioneering innovation countries and countries with good innovation performance located in Northern and Western Europe, while most of the countries with mediocre innovation performance and emerging innovation performance are located in Southern and Eastern Europe.
Based on their ranking, EU countries are divided into four performance groups: innovation leaders, countries with strong innovators, countries with moderate innovators and countries with emerging performance innovation (emerging innovators).
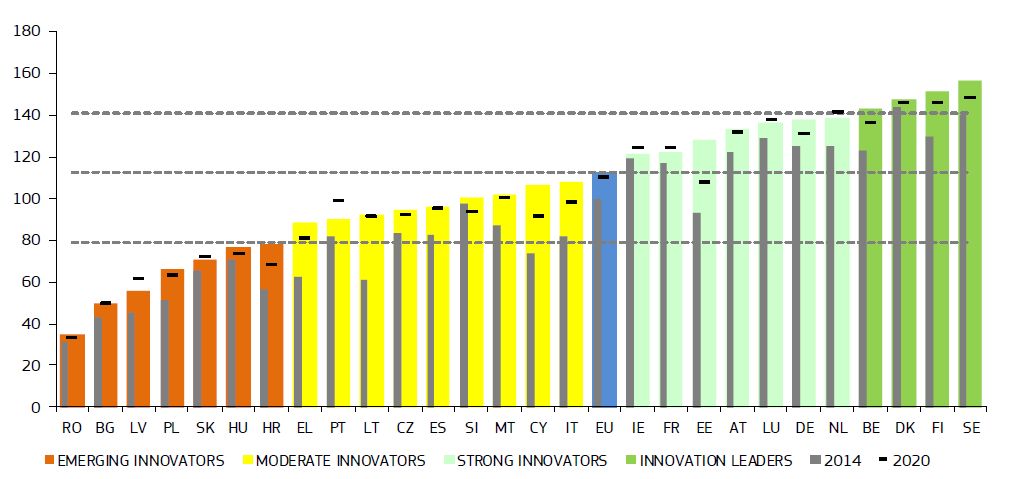
Figure 1: Ranking of countries in the European Innovation Scoreboard. Coloured columns show innovation performance in 2021, horizontal columns show performance in 2020 and grey columns reflect performance in 2014, all comparative to the EU average in 2014.
The performance of Greece
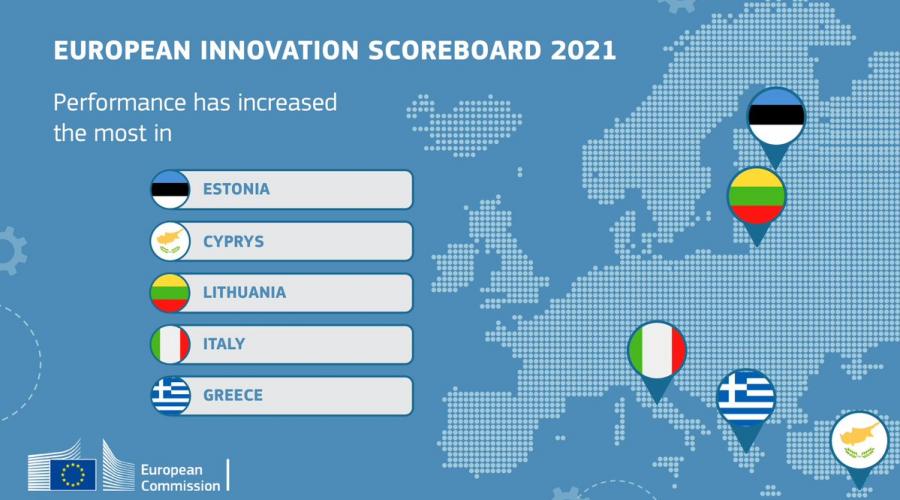
Greece is among the five Member States where performance has improved by 25 or more percentage points (Estonia, Cyprus, Lithuania, Italy, Greece). Between 2014 and 2021, Greece maintained a continuous upward trend, in the Summary Innovation Index, increasing from 63 points in 2014 to 79 in 2021. Specifically, Greece increased its performance by 25.9%, while the European average was 12.5%. This increase was greater in the last three years.
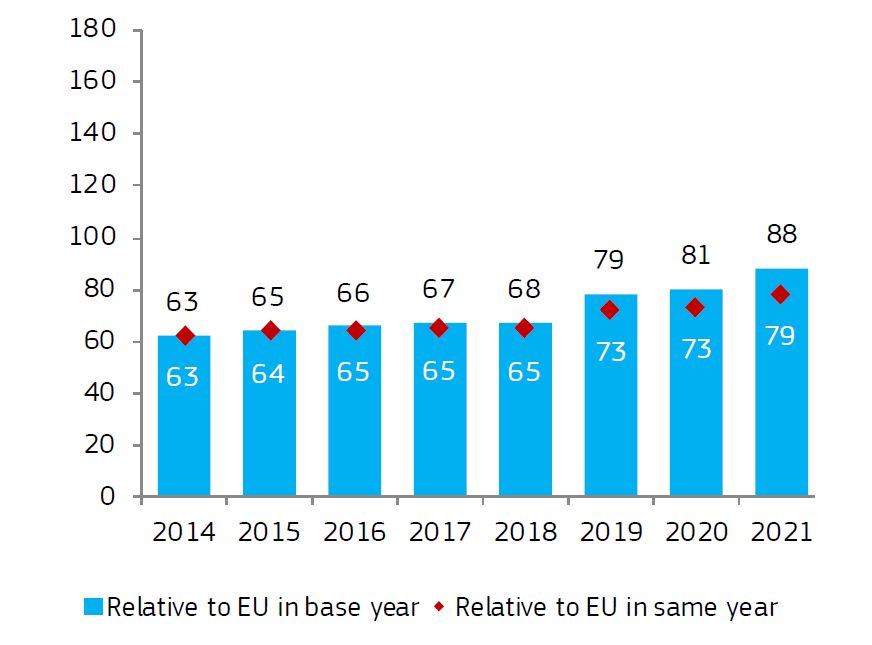
Figure 2:Increasing trend in the composite innovation indicator for Greece in the period 2014-2012.
Greece's strengths, with performances above the value of 100 corresponding to the EU average, lie in small and medium-sized enterprises (SMEs) that innovate (Innovators), interconnection and co-operation (Linkages) and employment (Employment impacts).(Figure 2)
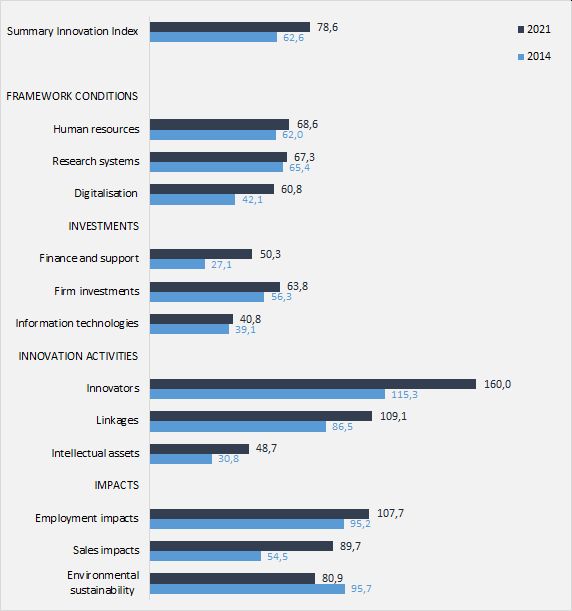
Figure 3.:greece's performance in the individual categories of the European Innovation Scoreboard, 2-24 & 2021
Greece's top three performers are sales of innovative products, innovative SMEs collaborating with others, and product innovators. Indicators for the population with higher education, expenditure on innovative activities (excluding R&D), public-private partnerships for the production of scientific publications, business process innovations and innovative business employment are also higher than the European average. (Figure 3).
The indicators showing the largest increase after 2018 are due to broadband penetration, venture capital, producth innovators, job-to-job mobility of human resources in science and technology and exports of medium and high tech goods.
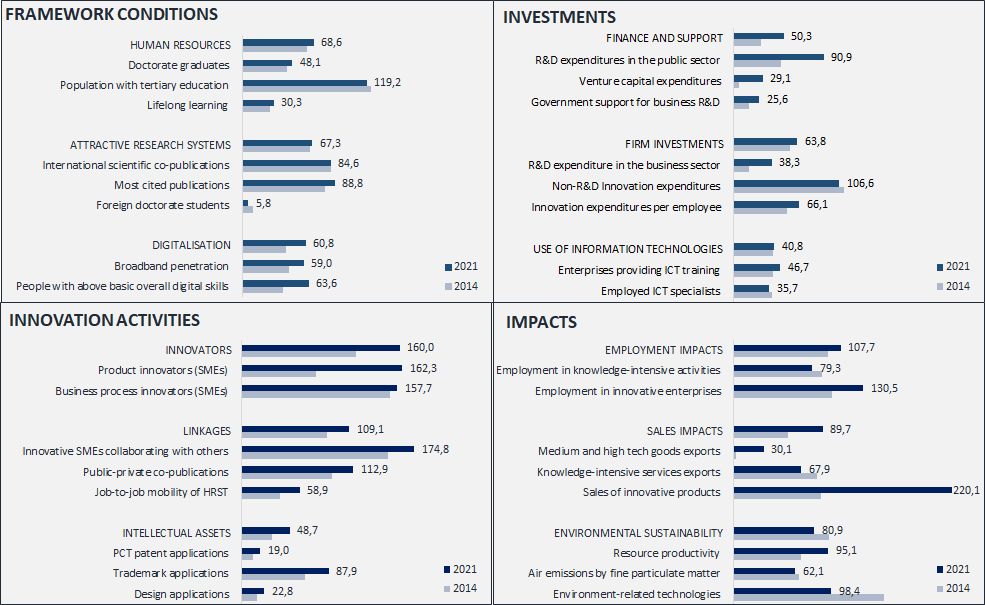
Figure 4: detailed presentation of Greece's performance in the indicators and sub-divisions of the European Innovation Scoreboard, 2014 & 2021
In terms of the structural characteristics of the innovation environment in relation to the EU (Figure 4), Greece performs better than the EU in the Innovation Profiles catgory. The percentage of Greek enterprises that innovate internally (develop innovations within the company, in house) is higher than the EU average. Finally, the performance of Greece is close to the European average in terms of Climate Change Indicators.
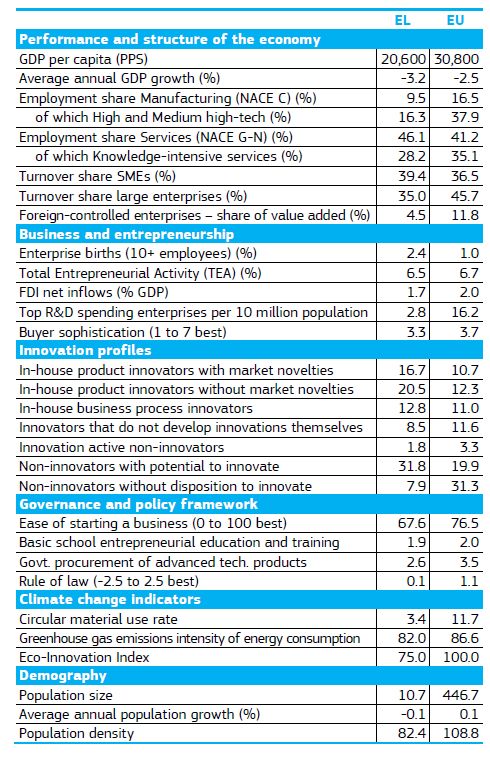
Figure 5: Structural characteristics of the innovation environment in Greece compared to the EU
EKT's contribution to the European Innovation Scoreboard ίας
EKT's contribution to the European Innovation Scoreboard
As the national Authority of the Hellenic Statistical System responsible for the production of national statistics on Technology, Development and Innovation and their transmission to Eurostat, the OECD and other international organisations, the National Documentation Centre (EKT) contributes to the production of innovation indicators presented in the European Innovation Scoreboard (EIS),
EKT trnasmits the Community Innovation Survey statistics to the EIS. Fom these 7 performance indicators are calculated ('Non R&D innovation expenditures', 'Innovation expenditures per person employed in innovation active enterprises','SMEs with product innovations', 'SMEs with business process innovations', 'InnovativeSMEs collaborating with others', 'Employment in innovative enterprises and 'Sales of product innovations') which are used to rank countries in addition to 7 indicators that describe the structural features of innovation in the Innovation profiles category. Also transmitted are the statistics for the Research & Development activities, from which 3 indicators are calculated ('R&D expenditure in the public sector','R&D expenditure in the business sector' and 'Government support for business R&D') and 1 indicator in the Business & Entrepreurship category on the structural features of innovation.
Relevant indicators and statistics are published on the website http://metrics.ekt.gr which is constantly enriched and updated, making it easier for policy makers, researchers, journalists, and the general public to stay informed through authoritative data and indicators.